wwavePDB Tutorial #1: Isolating a Sonic Hedgehog/Glycoprotein Molecular Switch
wwavePDB Overview
Tutorial Overview
Tutorial Content
(WEB PAGE PDF)
wwavePDB Overview
wwavePDB inputs a PDB file and outputs a PDB file and a sets file. The output PDB file contains all of the atoms that satisfy the spatial constraints selected when running wwavePDB. Output PDB files can be displayed with the input PDB structure for comparison. The sets file contains the information in the PDB file listed as specific sets of atom contacts.
wwavePDB Overview Page describes wwavePDB command line syntax.
Tutorial Overview
This tutorial uses wwavePDB to examine multiple, unrelated molecular structures in order to isolate and interpret a specific molecular interaction.
In this example, the environments of zinc atoms are analyzed and used to isolate a molecular switch between sonic hedgehog protein (SHH) and a fibronection III (FIII) domain. The example shows the advantage of using the wwavePDB analysis of multiple structures to interpret a single structural feature.
This tutorial uses the following structure files:
- 1AIY (NMR structure of human insulin hexamer) (PDB) (fasta) (summary)
- 1MEY (zinc finger bound to DNA) (PDB) (fasta) (summary)
- 3D1M (sonic hedgehog protein bound to the third domain of fibronectin) (PDB) (fasta) (summary)
Insulin (1AIY.pdb) is a hormone involved in glucose regulation. The zinc finger protein (1MEY.pdb) is a DNA-binding protein involved in transcriptional regulation. Sonic hedgehog (3D1M.pdb) is a factor involved in neural patterning, repair, and maintenance. Sonic hedgehog (SHH) orchestrates the development and maintenance of the nervous system starting with the development of the neural tube. SHH binds in a concentration-dependent manner to glycoproteins that govern neurite cell adhesion and spreading.
wwavePDB was used to isolate a molecular switch between SHH and a glycoprotein, fibronectin. In order to isolate the switch, the wwavePDB commands were structured to provide information on the environments of molecules bound to SHH and fibronectin, including mutual (SHH-fibronectin) binding, zinc atom binding, and calcium atom binding. The isolation of the SHH-fibronectin molecular switch required a detailed examination of other protein structures. In particular, it was necessary to examine the way in which other structures bind zinc in order to isolate the zinc-binding components of the molecular switch.
This example explains how wwavePDB was used to understand and isolate the residues in SHH and fibronectin that comprise the zinc-binding components of the molecular switch. Three protein structures, each with bound molecules that include zinc, are used as example input to wwavePDB: 1AIY.pdb, 1MEY.pdb, and 3D1M.pdb. The proteins in the examples structures have unrelated functions but all bind zinc.
Tutorial Content
wwavePDB is a program with a unix command line interface. wwavePDB accepts both terse single character options (e.g. “-i 3D1M.pdb”) and more verbose keyword options (e.g. “--input=3D1M.pdb”). Both terse and verbose options are shown in this tutorial as separately colored entries.
In this example, we use wwavePDB to explore the environment of bound zinc in these three exemplary proteins. In this example, wwavePDB is directed to:
- Input the PDB files:
- “--input=1AIY.pdb” or “-i 1AIY.pdb”
- “--input=1MEY.pdb” or “-i 1MEY.pdb”
- “--input=3D1M.pdb” or “-i 3D1M.pdb”
- Output a PDB file with a name that includes a specification of the protein and the specified distance range:
- “--output=1AIY_3.0” or “-o 1AIY_3.0”
- “--output=1AIY_3.5” or “-o 1AIY_3.5”
- “--output=1AIY_4.0” or “-o 1AIY_4.0”
- “--output=1AIY_4.5” or “-o 1AIY_4.5”
- “--output=1AIY_5.0” or “-o 1AIY_5.0”
- “--output=1MEY_3.0” or “-o 1MEY_3.0”
- “--output=1MEY_3.5” or “-o 1MEY_3.5”
- “--output=1MEY_4.0” or “-o 1MEY_4.0”
- “--output=1MEY_4.5” or “-o 1MEY_4.5”
- “--output=1MEY_5.0” or “-o 1MEY_5.0”
- “--output=3D1M_3.0” or “-o 3D1M_3.0”
- “--output=3D1M_3.5” or “-o 3D1M_3.5”
- “--output=3D1M_4.0” or “-o 3D1M_4.0”
- “--output=3D1M_4.5” or “-o 3D1M_4.5”
- “--output=3D1M_5.0” or “-o 3D1M_5.0”
- Output atoms that, as one requirement, must be found at distances from another atom that is at least one Angstrom:
- “--minimum=1.0” or “-a 1.0”
- “--maximum=3.0” or “-z 3.0”
- “--maximum=3.5” or “-z 3.5”
- “--maximum=4.0” or “-z 4.0”
- “--maximum=4.5” or “-z 4.5”
- “--maximum=5.0” or “-z 5.0”
- Output atoms that can be from any protein chain but, as one requirement, must have a heteroatom (including zinc) within the specified distance range:
- “--restrict=any_chains,atom_and_hetatm” or “-r 3c”
- Output any atoms or hetatoms within the previous specifications
- “--filter=output_any_atom_type” or “-f 6”
- Output a sets file that specifies the atoms in contact with each heteroatom:
- “--sets” or “-s”
The complete wwavePDB command lines for the proteins in this example are:
- FOR 1AIY:
- wwavePDB --input=1AIY.pdb --output=1AIY_3.0 --minimum=1.0 --maximum=3.0 \
--restrict=any_chains,atom_and_hetatm --filter=output_any_atom_type \
--sets - wwavePDB --input=1AIY.pdb --output=1AIY_3.5 --minimum=1.0 --maximum=3.5 \
--restrict=any_chains,atom_and_hetatm --filter=output_any_atom_type \
--sets - wwavePDB --input=1AIY.pdb --output=1AIY_4.0 --minimum=1.0 --maximum=4.0 \
--restrict=any_chains,atom_and_hetatm --filter=output_any_atom_type \
--sets - wwavePDB --input=1AIY.pdb --output=1AIY_4.5 --minimum=1.0 --maximum=4.5 \
--restrict=any_chains,atom_and_hetatm --filter=output_any_atom_type \
--sets - wwavePDB --input=1AIY.pdb --output=1AIY_5.0 --minimum=1.0 --maximum=5.0 \
--restrict=any_chains,atom_and_hetatm --filter=output_any_atom_type \
--sets - or
- wwavePDB -i 1AIY.pdb -o 1AIY_3.0 -a 1.0 -z 3.0 -r 3c -f 6 -s
- wwavePDB -i 1AIY.pdb -o 1AIY_3.5 -a 1.0 -z 3.5 -r 3c -f 6 -s
- wwavePDB -i 1AIY.pdb -o 1AIY_4.0 -a 1.0 -z 4.0 -r 3c -f 6 -s
- wwavePDB -i 1AIY.pdb -o 1AIY_4.5 -a 1.0 -z 4.5 -r 3c -f 6 -s
- wwavePDB -i 1AIY.pdb -o 1AIY_5.0 -a 1.0 -z 5.0 -r 3c -f 6 -s
- wwavePDB --input=1AIY.pdb --output=1AIY_3.0 --minimum=1.0 --maximum=3.0 \
- FOR 1MEY:
- wwavePDB --input=1MEY.pdb --output=1MEY_3.0 --minimum=1.0 --maximum=3.0 \
--restrict=any_chains,atom_and_hetatm --filter=output_any_atom_type \
--sets - wwavePDB --input=1MEY.pdb --output=1MEY_3.5 --minimum=1.0 --maximum=3.5 \
--restrict=any_chains,atom_and_hetatm --filter=output_any_atom_type \
--sets - wwavePDB --input=1MEY.pdb --output=1MEY_4.0 --minimum=1.0 --maximum=4.0 \
--restrict=any_chains,atom_and_hetatm --filter=output_any_atom_type \
--sets - wwavePDB --input=1MEY.pdb --output=1MEY_4.5 --minimum=1.0 --maximum=4.5 \
--restrict=any_chains,atom_and_hetatm --filter=output_any_atom_type \
--sets - wwavePDB --input=1MEY.pdb --output=1MEY_5.0 --minimum=1.0 --maximum=5.0 \
--restrict=any_chains,atom_and_hetatm --filter=output_any_atom_type \
--sets - or
- wwavePDB -i 1MEY.pdb -o 3D1M_3.0 -a 1.0 -z 3.0 -r 3c -f 6 -s
- wwavePDB -i 1MEY.pdb -o 3D1M_3.5 -a 1.0 -z 3.5 -r 3c -f 6 -s
- wwavePDB -i 1MEY.pdb -o 3D1M_4.0 -a 1.0 -z 4.0 -r 3c -f 6 -s
- wwavePDB -i 1MEY.pdb -o 3D1M_4.5 -a 1.0 -z 4.5 -r 3c -f 6 -s
- wwavePDB -i 1MEY.pdb -o 3DIM_5.0 -a 1.0 -z 5.0 -r 3c -f 6 -s
- wwavePDB --input=1MEY.pdb --output=1MEY_3.0 --minimum=1.0 --maximum=3.0 \
- FOR 3D1M:
- wwavePDB --input=3D1M.pdb --output=3D1M_3.0 --minimum=1.0 --maximum=3.0 \
--restrict=any_chains,atom_and_hetatm --filter=output_any_atom_type \
--sets - wwavePDB --input=3D1M.pdb --output=3D1M_3.5 --minimum=1.0 --maximum=3.5 \
--restrict=any_chains,atom_and_hetatm --filter=output_any_atom_type \
--sets - wwavePDB --input=3D1M.pdb --output=3D1M_4.0 --minimum=1.0 --maximum=4.0 \
--restrict=any_chains,atom_and_hetatm --filter=output_any_atom_type \
--sets - wwavePDB --input=3D1M.pdb --output=3D1M_4.5 --minimum=1.0 --maximum=4.5 \
--restrict=any_chains,atom_and_hetatm --filter=output_any_atom_type \
--sets - wwavePDB --input=3D1M.pdb --output=3D1M_5.0 --minimum=1.0 --maximum=5.0 \
--restrict=any_chains,atom_and_hetatm --filter=output_any_atom_type \
--sets - or
- wwavePDB -i 3D1M.pdb -o 3D1M_3.0 -a 1.0 -z 3.0 -r 3c -f 6 -s
- wwavePDB -i 3D1M.pdb -o 3D1M_3.5 -a 1.0 -z 3.5 -r 3c -f 6 -s
- wwavePDB -i 3D1M.pdb -o 3D1M_4.0 -a 1.0 -z 4.0 -r 3c -f 6 -s
- wwavePDB -i 3D1M.pdb -o 3D1M_4.5 -a 1.0 -z 4.5 -r 3c -f 6 -s
- wwavePDB -i 3D1M.pdb -o 3DIM_5.0 -a 1.0 -z 5.0 -r 3c -f 6 -s
- wwavePDB --input=3D1M.pdb --output=3D1M_3.0 --minimum=1.0 --maximum=3.0 \
Insulin has bound zinc and phenol atoms. ZNF has bound DNA, zinc, and chlorine atoms. SHH has both bound calcium atoms and zinc atoms. Using the commands above, wwavePDB will return information about the spatial interaction of the proteins and all of their bound molecules.
Upon execution of the commands, wwavePDB creates two files: a PDB-format file containing all atoms found and a wwavePDB sets file that specifies groups of interactions where there is at least one protein atom and one heteroatom.
For example, the following command line identifies histidine atoms that contact, within a distance of one to three Angstroms, the zinc atoms in the insulin structure:
- wwavePDB --input=1AIY.pdb --output=1AIY_3.0 --minimum=1.0 --maximum=3.0 \
--restrict=any_chains,atom_and_hetatm --filter=output_any_atom_type \
--sets - or
- wwavePDB -i 1AIY.pdb -o 1AIY_3.0 -a 1.0 -z 3.0 -r 3c -f 6 -s
The above command line would output the following atoms to the output PDB file:
ATOM 452 CG HIS B 10 4.435 0.059 -6.753 1.00 0.00 C
ATOM 453 ND1 HIS B 10 3.819 0.907 -7.659 1.00 0.00 N
ATOM 454 CD2 HIS B 10 3.421 -0.516 -6.027 1.00 0.00 C
ATOM 455 CE1 HIS B 10 2.492 0.821 -7.457 1.00 0.00 C
ATOM 456 NE2 HIS B 10 2.194 -0.032 -6.474 1.00 0.00 N
ATOM 465 CA LEU B 11 10.227 -0.639 -8.321 1.00 0.00 C
ATOM 1240 CG HIS D 10 2.453 -4.128 -22.489 1.00 0.00 C
ATOM 1241 ND1 HIS D 10 1.444 -4.137 -21.538 1.00 0.00 N
ATOM 1242 CD2 HIS D 10 2.258 -2.988 -23.230 1.00 0.00 C
ATOM 1243 CE1 HIS D 10 0.695 -3.035 -21.730 1.00 0.00 C
ATOM 1244 NE2 HIS D 10 1.148 -2.300 -22.749 1.00 0.00 N
ATOM 2028 CG HIS F 10 -2.439 3.241 -7.063 1.00 0.00 C
ATOM 2029 ND1 HIS F 10 -2.811 2.334 -8.044 1.00 0.00 N
ATOM 2030 CD2 HIS F 10 -1.508 2.594 -6.288 1.00 0.00 C
ATOM 2031 CE1 HIS F 10 -2.113 1.204 -7.836 1.00 0.00 C
ATOM 2032 NE2 HIS F 10 -1.304 1.308 -6.779 1.00 0.00 N
ATOM 2816 CG HIS H 10 2.262 3.500 -22.626 1.00 0.00 C
ATOM 2817 ND1 HIS H 10 2.735 2.576 -21.708 1.00 0.00 N
ATOM 2818 CD2 HIS H 10 1.333 2.833 -23.385 1.00 0.00 C
ATOM 2819 CE1 HIS H 10 2.095 1.415 -21.934 1.00 0.00 C
ATOM 2820 NE2 HIS H 10 1.229 1.516 -22.946 1.00 0.00 N
ATOM 3604 CG HIS J 10 -1.680 -4.426 -7.266 1.00 0.00 C
ATOM 3605 ND1 HIS J 10 -0.682 -4.248 -8.209 1.00 0.00 N
ATOM 3606 CD2 HIS J 10 -1.659 -3.299 -6.480 1.00 0.00 C
ATOM 3607 CE1 HIS J 10 -0.106 -3.055 -7.971 1.00 0.00 C
ATOM 3608 NE2 HIS J 10 -0.664 -2.435 -6.927 1.00 0.00 N
ATOM 4392 CG HIS L 10 -4.445 -0.231 -22.451 1.00 0.00 C
ATOM 4393 ND1 HIS L 10 -3.879 0.622 -21.517 1.00 0.00 N
ATOM 4394 CD2 HIS L 10 -3.402 -0.702 -23.209 1.00 0.00 C
ATOM 4395 CE1 HIS L 10 -2.552 0.637 -21.733 1.00 0.00 C
ATOM 4396 NE2 HIS L 10 -2.207 -0.154 -22.754 1.00 0.00 N
HETATM 4729 ZN ZN 1 0.004 -0.434 -5.873 1.00 0.00 ZN
HETATM 4730 ZN ZN 2 0.020 -0.362 -23.668 1.00 0.00 ZN
By way of example, the sets file generated by wwavePDB for the interaction between 1 and 3 Angstroms (“--minimum=1.0 --maximum=3.0” or “-a 1.0 -z 3.0”) specifies the spatial contact between the zinc atoms and the insulin protein residues for further for analysis and the color-coding of the pictures to follow:
------------------------------------------------------------------------------------
ATOM ATOM ATOM CHAIN RES. RESIDUE COORD COORD COORD
DISTANCE TYPE NAME # ID NAME # X Y Z
-------- ------- ---- ------- ----- ----- ------ -------- -------- --------
0.000 ATOM NE 456 B HIS 10 2.194 -0.032 -6.474
1.335 ATOM CE 455 B HIS 10 2.492 0.821 -7.457
1.393 ATOM CD 454 B HIS 10 3.421 -0.516 -6.027
2.220 ATOM ND 453 B HIS 10 3.819 0.907 -7.659
2.260 ATOM CG 452 B HIS 10 4.435 0.059 -6.753
2.306 HETATOM ZN 4729 ' ' ZN 1 0.004 -0.434 -5.873
ATOM ATOM ATOM CHAIN RES. RESIDUE COORD COORD COORD
DISTANCE TYPE NAME # ID NAME # X Y Z
-------- ------- ---- ------- ----- ----- ------ -------- -------- --------
0.000 ATOM NE 1244 D HIS 10 1.148 -2.300 -22.749
1.336 ATOM CE 1243 D HIS 10 0.695 -3.035 -21.730
1.392 ATOM CD 1242 D HIS 10 2.258 -2.988 -23.230
2.220 ATOM ND 1241 D HIS 10 1.444 -4.137 -21.538
2.261 ATOM CG 1240 D HIS 10 2.453 -4.128 -22.489
2.423 HETATOM ZN 4730 ' ' ZN 2 0.020 -0.362 -23.668
ATOM ATOM ATOM CHAIN RES. RESIDUE COORD COORD COORD
DISTANCE TYPE NAME # ID NAME # X Y Z
-------- ------- ---- ------- ----- ----- ------ -------- -------- --------
0.000 ATOM NE 2032 F HIS 10 -1.304 1.308 -6.779
1.335 ATOM CE 2031 F HIS 10 -2.113 1.204 -7.836
1.392 ATOM CD 2030 F HIS 10 -1.508 2.594 -6.288
2.219 ATOM ND 2029 F HIS 10 -2.811 2.334 -8.044
2.260 ATOM CG 2028 F HIS 10 -2.439 3.241 -7.063
2.359 HETATOM ZN 4729 ' ' ZN 1 0.004 -0.434 -5.873
ATOM ATOM ATOM CHAIN RES. RESIDUE COORD COORD COORD
DISTANCE TYPE NAME # ID NAME # X Y Z
-------- ------- ---- ------- ----- ----- ------ -------- -------- --------
0.000 ATOM NE 2820 H HIS 10 1.229 1.516 -22.946
1.336 ATOM CE 2819 H HIS 10 2.095 1.415 -21.934
1.392 ATOM CD 2818 H HIS 10 1.333 2.833 -23.385
2.219 ATOM ND 2817 H HIS 10 2.735 2.576 -21.708
2.260 ATOM CG 2816 H HIS 10 2.262 3.500 -22.626
2.347 HETATOM ZN 4730 ' ' ZN 2 0.020 -0.362 -23.668
ATOM ATOM ATOM CHAIN RES. RESIDUE COORD COORD COORD
DISTANCE TYPE NAME # ID NAME # X Y Z
-------- ------- ---- ------- ----- ----- ------ -------- -------- --------
0.000 ATOM NE 3608 J HIS 10 -0.664 -2.435 -6.927
1.336 ATOM CE 3607 J HIS 10 -0.106 -3.055 -7.971
1.392 ATOM CD 3606 J HIS 10 -1.659 -3.299 -6.480
2.221 ATOM ND 3605 J HIS 10 -0.682 -4.248 -8.209
2.261 ATOM CG 3604 J HIS 10 -1.680 -4.426 -7.266
2.358 HETATOM ZN 4729 ' ' ZN 1 0.004 -0.434 -5.873
ATOM ATOM ATOM CHAIN RES. RESIDUE COORD COORD COORD
DISTANCE TYPE NAME # ID NAME # X Y Z
-------- ------- ---- ------- ----- ----- ------ -------- -------- --------
0.000 ATOM NE 4396 L HIS 10 -2.207 -0.154 -22.754
1.337 ATOM CE 4395 L HIS 10 -2.552 0.637 -21.733
1.391 ATOM CD 4394 L HIS 10 -3.402 -0.702 -23.209
2.220 ATOM ND 4393 L HIS 10 -3.879 0.622 -21.517
2.260 ATOM CG 4392 L HIS 10 -4.445 -0.231 -22.451
2.416 HETATOM ZN 4730 ' ' ZN 2 0.020 -0.362 -23.668
ATOM ATOM ATOM CHAIN RES. RESIDUE COORD COORD COORD
DISTANCE TYPE NAME # ID NAME # X Y Z
-------- ------- ---- ------- ----- ----- ------ -------- -------- --------
0.000 HETATOM ZN 4729 ' ' ZN 1 0.004 -0.434 -5.873
2.306 ATOM NE 456 B HIS 10 2.194 -0.032 -6.474
2.358 ATOM NE 3608 J HIS 10 -0.664 -2.435 -6.927
2.359 ATOM NE 2032 F HIS 10 -1.304 1.308 -6.779
ATOM ATOM ATOM CHAIN RES. RESIDUE COORD COORD COORD
DISTANCE TYPE NAME # ID NAME # X Y Z
-------- ------- ---- ------- ----- ----- ------ -------- -------- --------
0.000 HETATOM ZN 4730 ' ' ZN 2 0.020 -0.362 -23.668
2.347 ATOM NE 2820 H HIS 10 1.229 1.516 -22.946
2.416 ATOM NE 4396 L HIS 10 -2.207 -0.154 -22.754
2.423 ATOM NE 1244 D HIS 10 1.148 -2.300 -22.749
The output PDB format files can be displayed along with the input PDB file (e.g., 1AIY.pdb) for comparison. Selecting multiple distance ranges in multiple command lines (as detailed above by using “--minimum=” or “-a” and by using “--maximum=” or “-z”) generates a detailed specification of the environments of the heteroatoms as a function of distance.
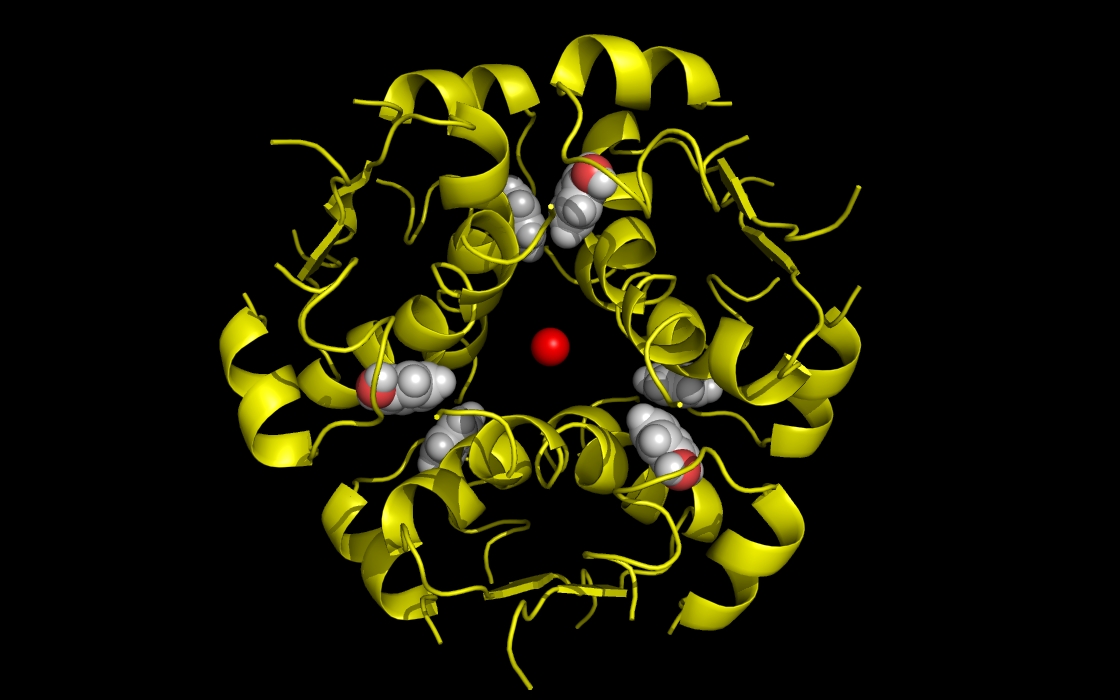
Figure 1a. wwavePDB INPUT: insulin structure cartoon with bound zinc and phenol atoms. The insulin structure cartoon and bound zinc and phenol heteroatoms are shown without any wwavePDB output displayed. The insulin hexamer structure cartoon is shown in yellow. Zinc atoms are shown as red spheres. Phenol residues are shown as white carbon and red oxygen spheres.
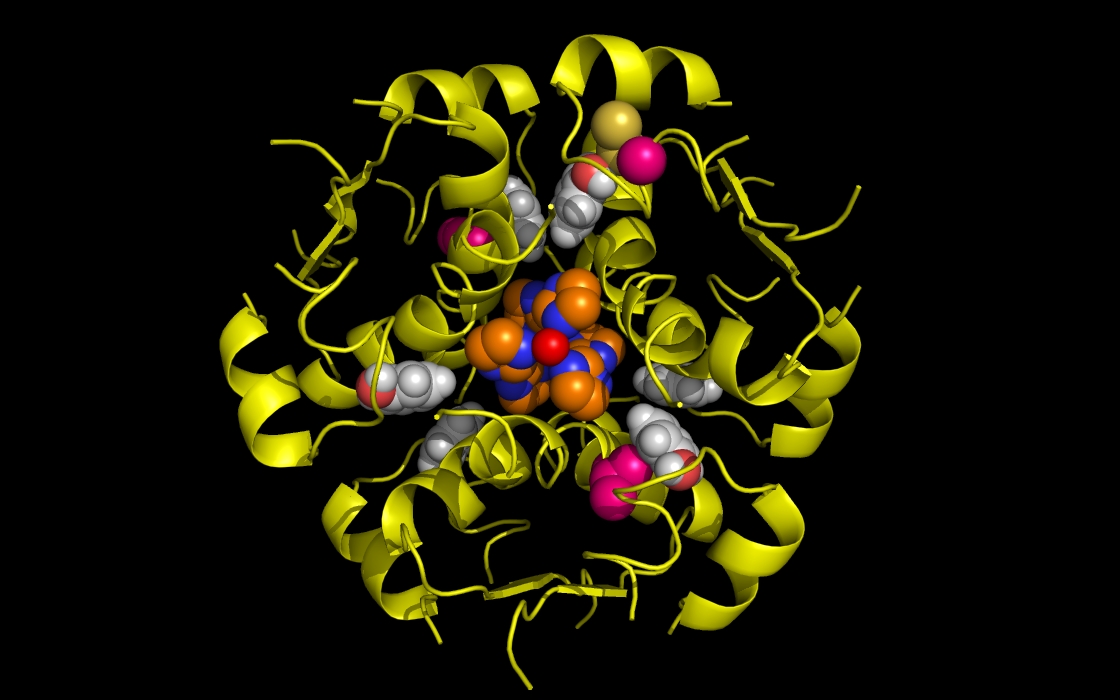
Figure 1b. wwavePDB INPUT AND OUTPUT: insulin structure cartoon and wwavePDB “_1AIY_3.0” output. The insulin structure cartoon is displayed with wwavePDB output (“--output=1AIY_3.0” or “-o 1AIY_3.0”). The insulin hexamer structure cartoon is shown in yellow. Zinc atoms are shown as red spheres. Phenol residues are shown as white carbon and red oxygen spheres. Insulin histidine residue atoms in contact with the zinc are shown as orange carbons, blue nitrogens, and red oxygens. Insulin residues in contact with the phenols but not in contact with the zinc are shown as magenta carbons, blue nitrogens, and red oxygens. The zinc atoms bound by insulin are coordinated by a radial array of three insulin histidine residues (“RAD ZN”).
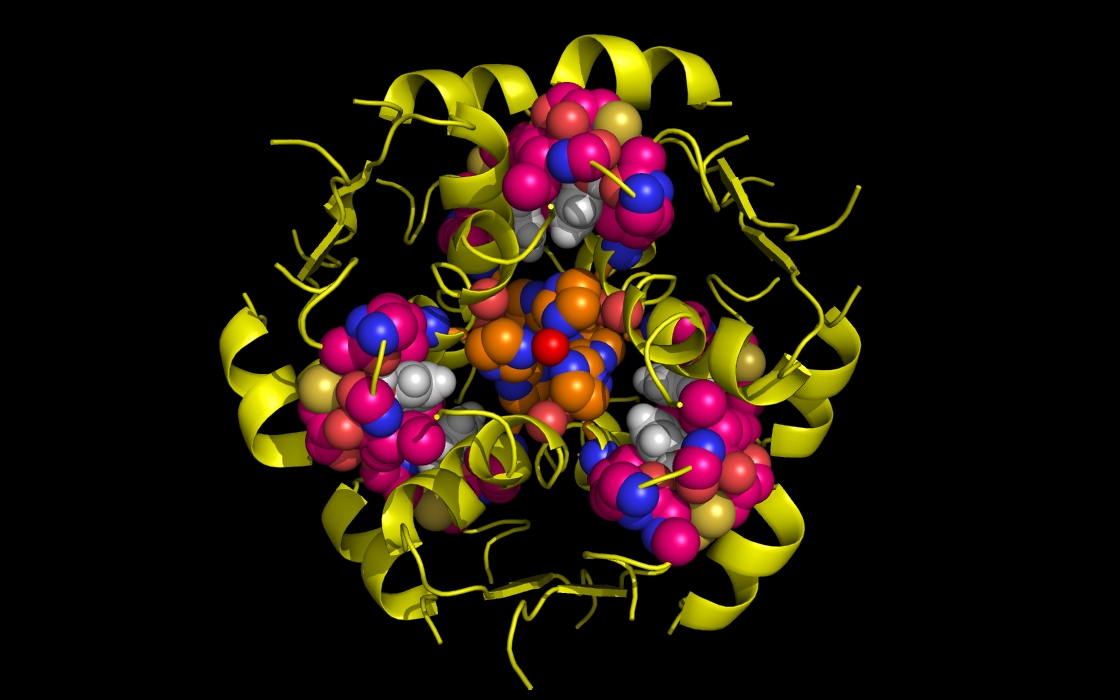
Figure 1c. wwavePDB INPUT AND OUTPUT: insulin structure cartoon and wwavePDB “_1AIY_3.5” output. The insulin structure cartoon is displayed with wwavePDB output (“--output=1AIY_3.5” or “-o 1AIY_3.5”). The insulin hexamer structure cartoon is shown in yellow. Zinc atoms are shown as red spheres. Phenol residues are shown as white carbon and red oxygen spheres. Insulin histidine residue atoms in contact with the zinc are shown as orange carbons, blue nitrogens, and red oxygens. Insulin residues in contact with the phenols but not in contact with the zinc are shown as magenta carbons, blue nitrogens, and red oxygens.
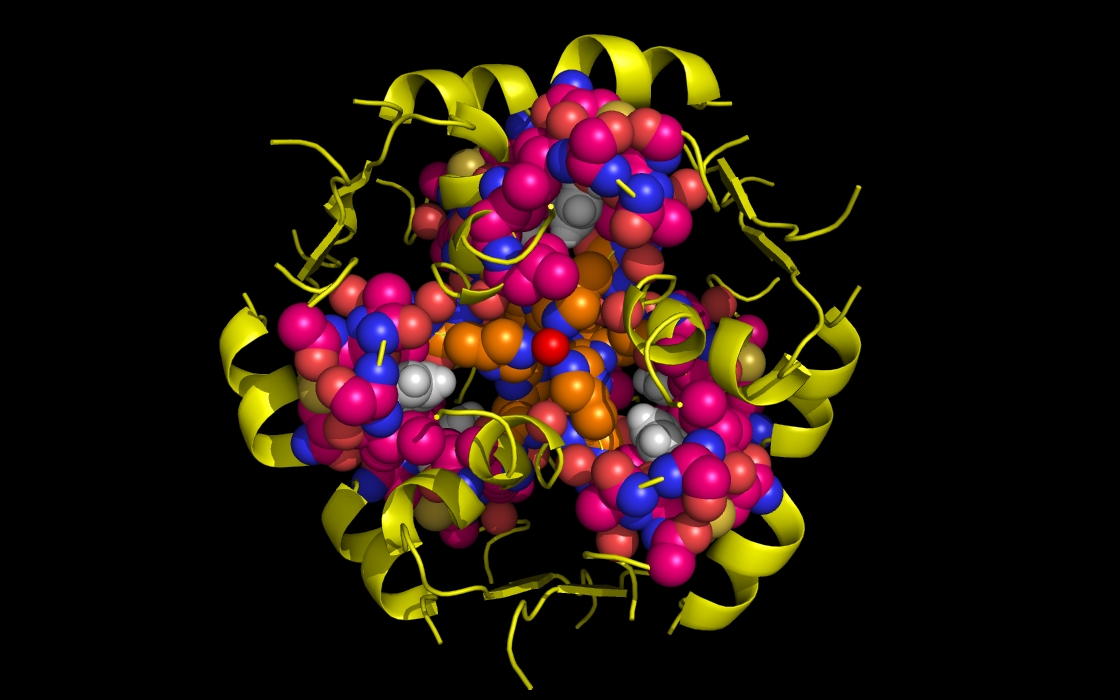
Figure 1d. wwavePDB INPUT AND OUTPUT: insulin structure cartoon and wwavePDB “_1AIY_4.0” output. The insulin structure cartoon is displayed with wwavePDB output (“--output=1AIY_4.0” or “-o 1AIY_4.0”). The insulin hexamer structure cartoon is shown in yellow. Zinc atoms are shown as red spheres. Phenol residues are shown as white carbon and red oxygen spheres. Insulin histidine residue atoms in contact with the zinc are shown as orange carbons, blue nitrogens, and red oxygens. Insulin residues in contact with the phenols but not in contact with the zinc are shown as magenta carbons, blue nitrogens, and red oxygens.
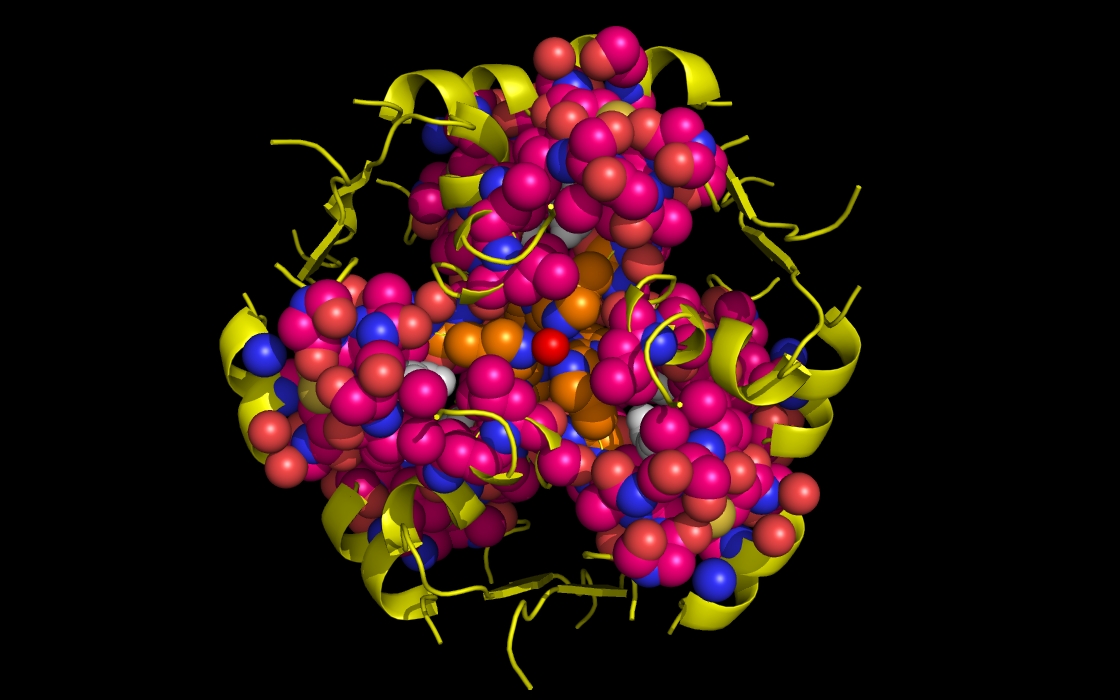
Figure 1e. wwavePDB INPUT AND OUTPUT: insulin structure cartoon and wwavePDB “_1AIY_4.5” output. The insulin structure cartoon is displayed with wwavePDB output (“--output=1AIY_4.5” or “-o 1AIY_4.5”). The insulin hexamer structure cartoon is shown in yellow. Zinc atoms are shown as red spheres. Phenol residues are shown as white carbon and red oxygen spheres. Insulin histidine residue atoms in contact with the zinc are shown as orange carbons, blue nitrogens, and red oxygens. Insulin residues in contact with the phenols but not in contact with the zinc are shown as magenta carbons, blue nitrogens, and red oxygens.

Figure 1f. wwavePDB INPUT AND OUTPUT: insulin structure cartoon and wwavePDB “_1AIY_5.0” output. The insulin structure cartoon is displayed with wwavePDB output (“--output=1AIY_5.0” or “-o 1AIY_5.0”). The insulin hexamer structure cartoon is shown in yellow. Zinc atoms are shown as red spheres. Phenol residues are shown as white carbon and red oxygen spheres. Insulin histidine residue atoms in contact with the zinc are shown as orange carbons, blue nitrogens, and red oxygens. Insulin residues in contact with the phenols but not in contact with the zinc are shown as magenta carbons, blue nitrogens, and red oxygens.
The insulin example defines one type of interaction of proteins with zinc: three histidines coordinating the zinc arrayed radially (“RAD ZN”).
The zinc finger protein (ZFN) illustrates a different interaction of proteins with zinc: two histidines and two cysteines coordinating the zinc arrayed in a tetrahedron (“TET ZN”).
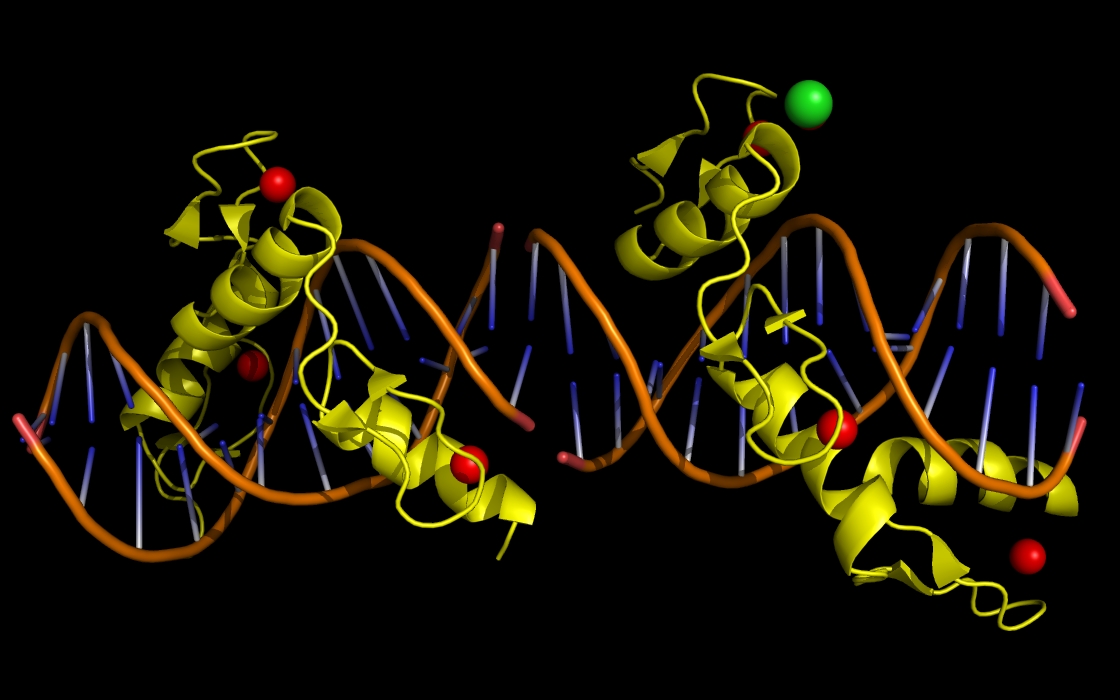
Figure 2a. wwavePDB INPUT: zinc finger protein (ZNF) structure cartoon with bound zinc and phenol atoms. The zinc finger protein structure cartoon and bound DNA, zinc atoms, and chlorine atoms are displayed without any wwavePDB output. The zinc finger structure cartoon is shown in yellow. Zinc atoms are shown as red spheres. Chlorine atoms are shown as green spheres. DNA is shown as an orange structure cartoon.
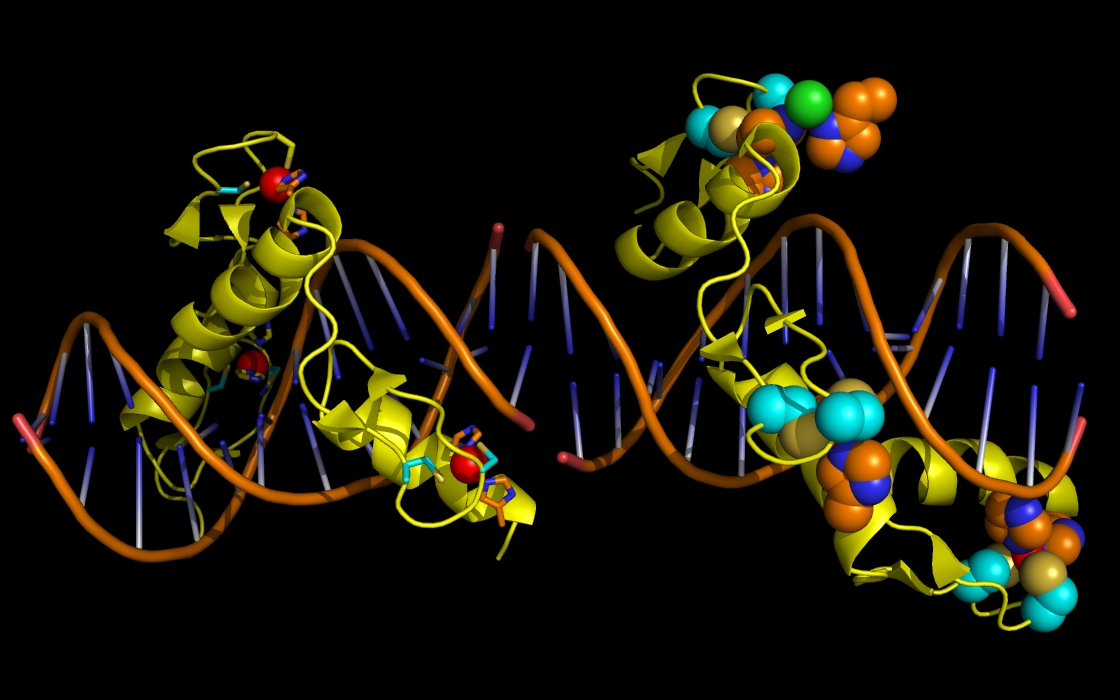
Figure 2b. wwavePDB INPUT AND OUTPUT: ZNF structure cartoon and wwavePDB output (“_1MEY_3.0”). The zinc finger protein (ZFN) structure cartoon and bound DNA, zinc atoms, and chlorine atoms are displayed with wwavePDB output (“--output=1MEY_3.0” or “-o 1MEY_3.0”). The zinc finger structure cartoon is shown in yellow. Zinc atoms are shown as red spheres. Chlorine atoms are shown as green spheres. DNA is shown as an orange structure cartoon. ZFN histidine residue atoms in contact with the zinc are shown as orange carbons, blue nitrogens, and red oxygens. ZFN cysteine residue atoms in contact with the zinc are shown as cyan carbons, gold sulfurs, blue nitrogens, and red oxygens. On the left ZFN monomer, the ZFN residues are shown as sticks. On the right ZFN monomer, the ZFN residues are shown as spheres. The zinc atoms bound by ZFN are coordinated by a tetrahedral array of ZFN residues: two cysteines and two histidines (“TET ZN”).
Isolation of the radial (“RAD ZN”) configuration in insulin and the tetrahedron (“TET ZN”) configuration in ZFN allows us to recognize a combination of these configurations in sonic hedgehog protein (SHH).
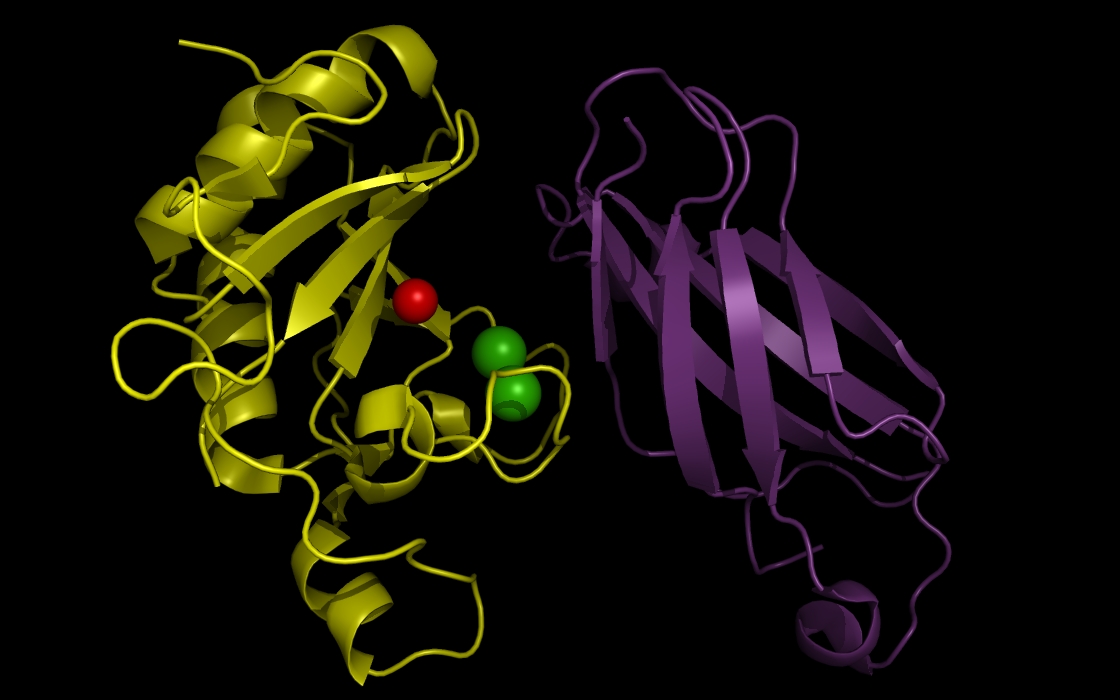
Figure 3a. wwavePDB INPUT: sonic hedgehog protein, fibronectin III domain, a zinc atom, and calcium atoms. The sonic hedgehog protein (SHH), the fibronectin III domain (FIII), a zinc atom, and two calcium atoms are displayed without any wwavePDB output. The SHH structure cartoon is shown in yellow. The FIII structure cartoon is shown in purple. Zinc atoms are shown as red spheres. Calcium atoms are shown as green spheres.

Figure 3b. wwavePDB INPUT AND OUTPUT: SHH, FIII domain, ZN atom, CA atoms, and wwavePDB output (“_3D1M_3.0”). Tahe sonic hedgehog protein (SHH), the fibronectin III domain (FIII), a zinc atom, and two calcium atoms are displayed with wwavePDB output (“--output=3D1M_3.0” or “-o 3D1M_3.0”). The SHH structure cartoon is shown in yellow. The FIII structure cartoon is shown in purple. Zinc atoms are shown as red spheres. Calcium atoms are shown as green spheres. SHH residues within 3.0 Angstroms of the zinc and calcium atoms are shown as sticks with yellow carbons, blue nitrogens, and red oxygens. At this distance, atoms from two histidines, an aspartic acid, and a glutamic acid are within 3 Angstroms of the zinc atom. At this distance, multiple aspartic acid and glutamic acid atoms are within 3 Angstroms of the calcium atoms.

Figure 3c. wwavePDB INPUT AND OUTPUT: SHH, FIII domain, ZN atom, CA atoms, and wwavePDB output (“_3D1M_3.5”). The sonic hedgehog protein (SHH), the fibronectin III domain (FIII), a zinc atom, and two calcium atoms are displayed with wwavePDB output (“--output=3D1M_3.5” or “-o 3D1M_3.5”). The SHH structure cartoon is shown in yellow. The FIII structure cartoon is shown in purple. Zinc atoms are shown as red spheres. Calcium atoms are shown as green spheres. SHH residues within 3.5 Angstroms of the zinc and calcium atoms are shown as sticks with yellow carbons, blue nitrogens, and red oxygens. At this distance, atoms from three histidines, an aspartic acid, and a glutamic acid are within 3 Angstroms of the zinc atom. At this distance, multiple aspartic acid and glutamic acid atoms are within 3.5 Angstroms of the calcium atoms. In addition, atoms from FIII are within 3.5 Angstroms of the calcium atoms.

Figure 3d. wwavePDB INPUT AND OUTPUT: SHH, FIII domain, ZN atom, CA atoms,and wwavePDB output (“_3D1M_4.0”). The sonic hedgehog protein (SHH), the fibronectin III domain (FIII), a zinc atom, and two calcium atoms are displayed with wwavePDB output (“--output=3D1M_4.0” or “-o 3D1M_4.0”). The SHH structure cartoon is shown in yellow. The FIII structure cartoon is shown in purple. Zinc atoms are shown as red spheres. Calcium atoms are shown as green spheres. SHH residues within 4.0 Angstroms of the zinc and calcium atoms are shown as sticks with yellow carbons, blue nitrogens, and red oxygens. At this distance, atoms from three histidines, an aspartic acid, and a glutamic acid are within 4 Angstroms of the zinc atom. At this distance, multiple aspartic acid and glutamic acid atoms are within 4 Angstroms of the calcium atoms. In addition, atoms from FIII are within 4 Angstroms of the calcium atoms.
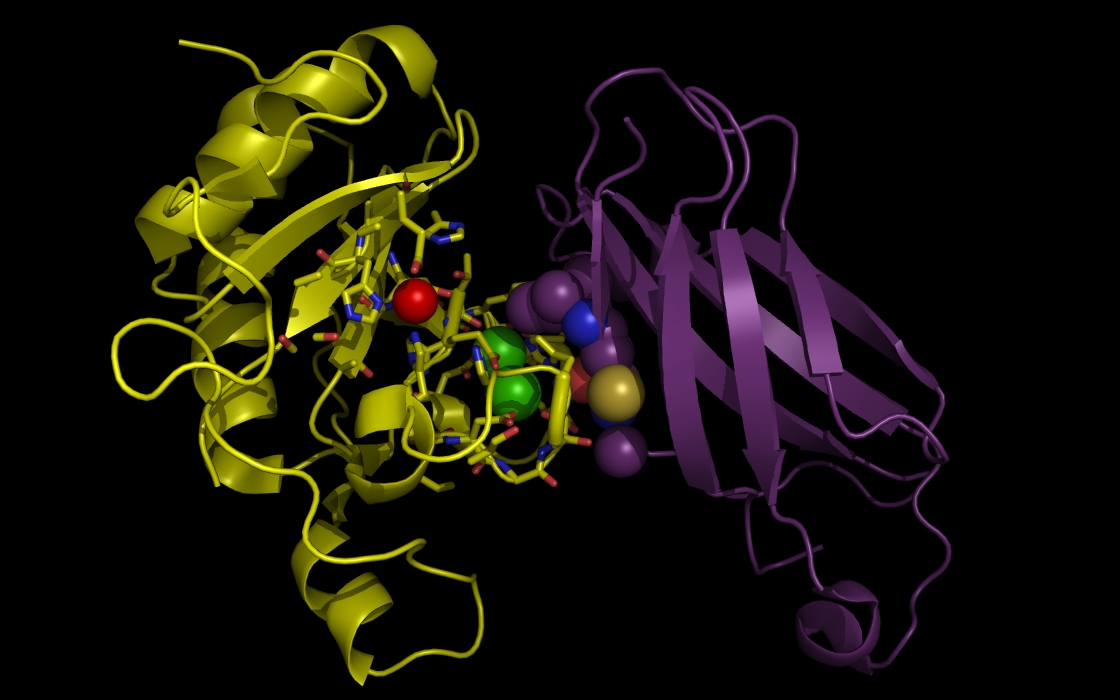
Figure 3e. wwavePDB INPUT AND OUTPUT: SHH, FIII domain, ZN atom, CA atoms, and wwavePDB output (“_3D1M_4.5”). The sonic hedgehog protein (SHH), the fibronectin III domain (FIII), a zinc atom, and two calcium atoms are displayed with wwavePDB output (“--output=3D1M_4.5” or “-o 3D1M_4.5”). The SHH structure cartoon is shown in yellow. The FIII structure cartoon is shown in purple. Zinc atoms are shown as red spheres. Calcium atoms are shown as green spheres. SHH residues within 4.5 Angstroms of the zinc and calcium atoms are shown as sticks with yellow carbons, blue nitrogens, and red oxygens. At this distance, atoms from five histidines, an aspartic acid, and a glutamic acid are within 4.5 Angstroms of the zinc atom. At this distance, two histidines, multiple aspartic acid and glutamic acid atoms are within 4.5 Angstroms of the calcium atoms. In addition, atoms from FIII are within 4.5 Angstroms of the calcium atoms, including a cysteine residue that can coordinate the zinc atom that is bound to the SHH in an alternative binding position for the zinc atom.

Figure 3f. wwavePDB INPUT AND OUTPUT: SHH, FIII domain, ZN atom, CA atoms, and wwavePDB output (“_3D1M_5.0”). The sonic hedgehog protein (SHH), the fibronectin III domain (FIII), a zinc atom, and two calcium atoms are displayed with wwavePDB output (“--output=3D1M_5.0” or “-o 3D1M_5.0”). The SHH structure cartoon is shown in yellow. The FIII structure cartoon is shown in purple. Zinc atoms are shown as red spheres. Calcium atoms are shown as green spheres. SHH residues within 5.0 Angstroms of the zinc and calcium atoms are shown as sticks with yellow carbons, blue nitrogens, and red oxygens. At this distance, atoms from five histidines, an aspartic acid, and a glutamic acid are within 5.0 Angstroms of the zinc atom. At this distance, two histidines, multiple aspartic acid and glutamic acid atoms are within 5.0 Angstroms of the calcium atoms. In addition, atoms from FIII are within 5.0 Angstroms of the calcium atoms, including a cysteine residue that can coordinate the zinc atom that is bound to the SHH in an alternative binding position for the zinc atom.
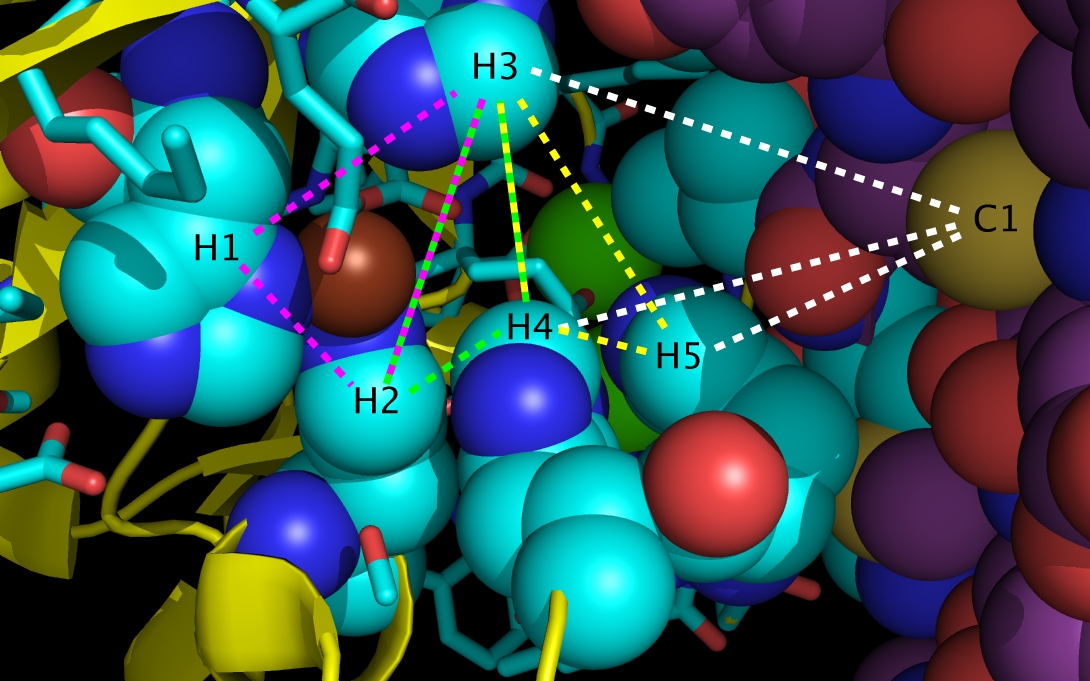
Figure 3g. wwavePDB INPUT AND OUTPUT: The SHH-FIII Zn switch (“_3D1M_5.0”). The sonic hedgehog protein (SHH), the fibronectin III domain (FIII), a zinc atom, and two calcium atoms are displayed with wwavePDB output (“--output=3D1M_5.0” or “-o 3D1M_5.0”). The SHH structure cartoon is shown in yellow. The FIII structure spheres is shown with purple carbons, gold sulfurs (including C1 residue sulfur), blue nitrogens, and red oxygens. The zinc atom is shown as a brown sphere. Calcium atoms are shown as green spheres. SHH residues within 5 Angstroms of the zinc and calcium atoms are shown as sticks with yellow carbons, blue nitrogens, and red oxygens with the exception of the five histidine residues shown as spheres. The SHH histidines spheres in the wwavePDB output are shown with cyan carbons, blue nitrogens, and red oxygens and are labelled H1, H2, H3, H4, and H5. Alternative radially coordinated zinc positions are shown bounded by magenta, green, and yellow dashed lines. An alternative tetrahedrally coordinated zinc position is shown bounded by white dashed lines.
Bound zinc can be coordinated radially (“RAD ZN”) by any of the triangle of residues labelled:
- a. H1, H2, and H3
- b. H2, H3, and H4
- c. H3, H4, and H5
Bound zinc can be coordinated tetrahedrally (“TET ZN”) with the four residues labelled:
- a. H3, H4, H5, and C1 (a cysteine from FIII)
The basis of the switch is determined by whether the zinc is coordinated internally to SHH or whether the zinc is coordinated between SHH and the glycoprotein. When the switch is “off”, the bound zinc is bound by the SHH only. When the switch is “on”, the bound zinc is bound by both SHH and FIII. This switch mechanism is also found between SHH and other glycoproteins such as NCAM.
The structural interaction between SHH and glycoproteins becomes interpretable through analyzing the zinc environments of multiple unrelated proteins with wwavePDB.